


3D UI/UX Design Guide 2025: How to Build Immersive, Intuitive, and Interactive Experiences
Sharing
Introduction
Improving digital user interfaces (UI) and user experiences (UX) hinges on understanding and leveraging data about user behavior. In today’s competitive digital landscape, where a product’s success is often tied to its look-and-feel, a continuous and iterative UX design process is essential. This article explores the critical role of UI/UX metrics and Key Performance Indicators (KPIs) in this process, providing a detailed overview of how to measure design effectiveness and drive improvements.
Why measure UI and UX design?
Measuring UI and UX design is not merely a technical exercise; it’s a strategic imperative. The article emphasizes several key reasons why software developers and design teams should prioritize this:
- Data-Driven Decisions: UX design KPIs provide objective data that supports informed design choices, leading to improved product performance and a stronger bottom line.
- Alignment of Goals: Effective use of UX data helps align customer needs with business objectives, fostering overall project success.
- Enhanced Communication: UX data promotes shared understanding and consensus among product team members, clients, and vendors.
- Deeper User Insights: Analyzing user behavior data reveals valuable information about the target audience, including preferences, pain points, and interaction patterns.
- Bridging the Gap: A thorough understanding of end-users enables product development teams to bridge the gap between designer intentions and user realities, resulting in more competitive UX and interfaces.
- Minimizing Errors: Data-driven UX design reduces the risk of errors that result from subjective assumptions about user behavior.
- Cost Efficiency: Data investigation helps avoid wasting resources on ineffective or detrimental design choices.
- ROI Improvement: Informed product development decisions based on UX data can lead to a tangible improvement in Return on Investment (ROI) through increased conversion rates, higher sales, better customer retention, and reduced support costs.
- Driving Innovation: Customer analytics data can uncover new trends and support innovative design ideas, moving beyond reliance on best practices.
- Validation of Success: Positive trends in UX design metrics (e.g., customer satisfaction, engagement, churn) validate the effectiveness of the team’s work.

Understanding UI/UX KPIs
A UX KPI is a quantifiable measure of a specific aspect of a user’s experience. For example, tracking the average time users spend daily in an app can help evaluate user engagement and satisfaction.
The article clarifies that there isn’t a single, universally accepted classification of UX and UI metrics. However, when aiming to understand user needs and behavior, teams often utilize two primary categories:
- Behavioral UX Metrics: These metrics focus on what users do within a digital product.
- Attitudinal UX KPIs: These metrics focus on how users feel about the product.
Behavioral UX metrics: Measuring user actions
Behavioral UX metrics provide insights into how users interact with a digital product throughout their customer journey. These metrics are typically gathered through usability testing and analytics tools.
The article highlights that usability is a foundational aspect of UX design, stating that “the UX/UI designer and app developers must ensure at least that the users can do what they want to do with the product.” The four dimensions of usability testing are:
- Functionality
- Flexibility
- Learning ability
- medium.com
- Aesthetic user interface design
Common tools for monitoring behavioral UX metrics include Google Analytics, Hotjar, Mixpanel, Heap, Localytics, Kissmetrics, Crashlytics, Firebase, and Crazy Egg.
The article provides three examples of behavioral UX KPIs:
- Task Success: This metric measures the percentage of users who successfully complete a defined task (e.g., completing a profile).
- Task Time: This metric measures the time it takes users to complete a task. Average Task Time is often calculated.
- Problems & Frustrations: This metric tracks the number of problems users encounter or the percentage of users who experience a specific issue. “Think aloud” protocols during usability testing are helpful for gathering this data.
Behavioral KPIs are often compared over time or against competitor benchmarks to assess progress and identify areas for improvement.

Attitudinal UX KPIs: Measuring user feelings
Attitudinal UX KPIs reveal users’ perceptions and feelings about a product and brand. This data is often gathered through customer feedback and surveys.
The article emphasizes three important attitudinal UX KPIs:
- Net Promoter Score (NPS): Measures customer loyalty by asking users how likely they are to recommend the product. Users are categorized as “promoters,” “passives,” or “detractors,” and the NPS is calculated as the percentage of promoters minus the percentage of detractors.
- System Usability Scale (SUS): A standardized questionnaire that assesses the perceived usability of a product. Users rate their agreement with statements about the product’s ease of use.
- Customer Satisfaction (CSAT): Measures user satisfaction with a specific experience or the product overall. Surveys with rating scales are used to collect this data.
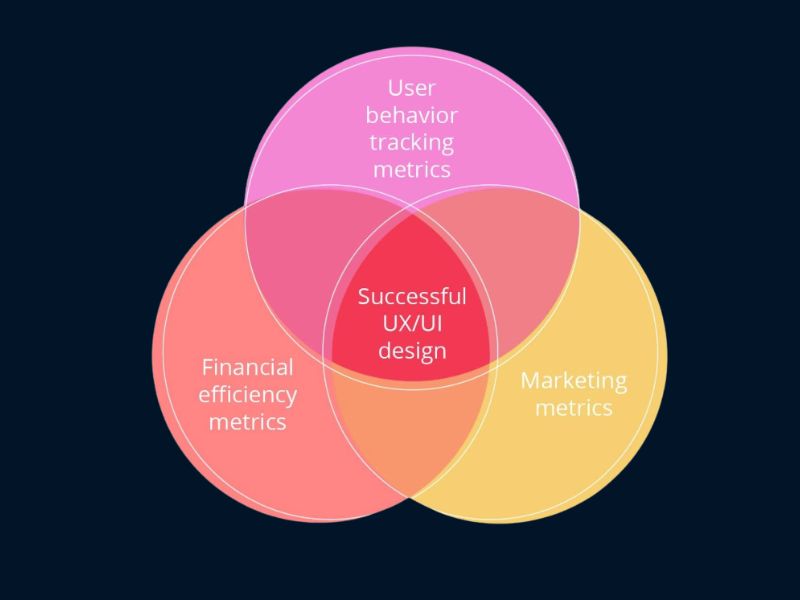
The article stresses the importance of combining behavioral and attitudinal metrics with financial and sales/marketing data for a comprehensive understanding of UX effectiveness.
Measuring ROI in UI and UX design
To evaluate the return on investment (ROI) of UI and UX design efforts, the article suggests focusing on the following metrics:
- Conversion Rate: The percentage of users who complete a desired action (e.g., registration, purchase). This is considered a crucial KPI for UX designers, as optimization can directly impact sales.
- Drop-off Rate: The percentage of users who abandon a process before completing the desired action. Analyzing drop-off rates in different segments of a user journey helps identify areas where users are leaving.
- Single Usability Metric (SUM): A standardized metric that combines task completion rates, task time, user satisfaction, and errors to provide an overall measure of usability.
The article also mentions “low-level metrics” such as page views, engaged page views, and latency.
Google HEART metrics
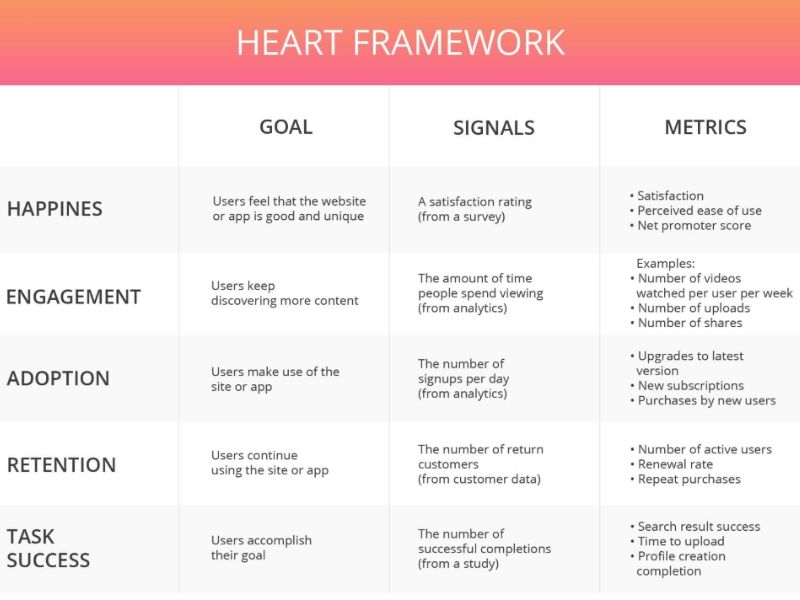
The article introduces Google’s HEART framework as a way to combine essential KPIs and gain a deeper understanding of design effectiveness:
- Happiness: Measures user enjoyment.
- Engagement: Measures user involvement.
- Adoption: Measures the acquisition of new users.
- Retention: Measures the ability to retain existing users.
- Task Success: Measures the effectiveness, efficiency, and error rate of user tasks.
Onix’s tips for evaluating user experience design
Drawing on their experience, Onix provides the following recommendations for evaluating UX design:
- Keep the “Big Picture” in Mind: Analyze the product from a business perspective, considering its business model, monetization methods, and strategy. Conduct competitor analysis to identify opportunities. Ensure Google Analytics is properly configured.
- Prioritize Key Metrics: Focus on a few key UX KPIs that deliver the most value to customers and the business (e.g., conversion rate, drop-off rate, returning users rate). Gather as much relevant data as possible for each metric.
- Discover Correlations and Build Hypotheses: Go beyond surface-level numbers to understand the “why” behind user behavior. Use Google Analytics to track relevant behavioral metrics (e.g., device usage, time on page, clicks) and identify correlations. Form hypotheses about potential improvements.
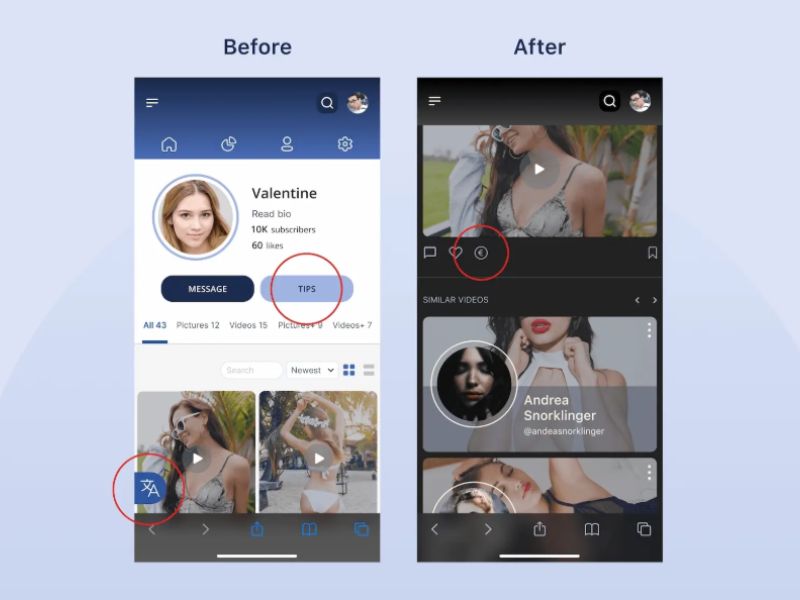
- Test Hypotheses and Evaluate Improvements: Use A/B testing or compare before-and-after metrics to validate hypotheses and assess the impact of design changes.
The article includes a case study demonstrating how data-driven design improvements can lead to significant positive outcomes (e.g., increased donations on a content subscription platform).
Conclusion
The article concludes by emphasizing that UI and UX design is an iterative process of continuous improvement. Product development teams must plan for and implement ongoing measurement of design effectiveness.
The use of UX KPIs enables teams to enhance user convenience, product popularity, and market success. The article advises choosing KPIs that align with business goals, involving users in the process, and gathering feedback throughout design phases.
While conversion rate is highlighted as a crucial KPI, the article cautions against relying solely on low-level metrics or marketing/financial data without considering user feedback. It recommends using a combination of data sources, including surveys, user interviews, user journey research, and feedback from customer support and sales teams.
FAQ (From the Article):
The article also provides a brief FAQ section defining UI and UX design, explaining the importance of measuring design quality, and describing UX KPIs.
What are UI design and UX design?
- UI (User Interface) refers to the point of interaction and communication between a human and a computer. In the context of web and mobile development, UI design involves arranging a product’s graphical layout and content to create a cohesive and visually appealing experience, adhering to established design principles.
- UX (User Experience) denotes a human-centered approach to developing and improving digital products. UX design focuses on identifying and solving user problems, ensuring that the interaction with the product is efficient, easy, relevant, and enjoyable for a wide range of users.
- UI design complements UX design by addressing the digital product’s visual elements, presentation, and interactive features. Both UI and UX are integral and work in tandem to achieve product success.
Why is it necessary to measure design quality and performance?
The development of most successful products is data-driven, meaning it relies on quantitative data to understand the target audience. Similarly, UI and UX must be measured to enable teams to make informed improvements.
Specifically, by measuring user experience, teams can:
- Determine if one design version is superior to another or to a competitor’s product.
- Gain insights into how users are actually interacting with the product.
- Identify the specific problems users are trying to solve.
- And more.
What are UX KPIs?
- UX KPIs (Key Performance Indicators) are metrics that product development teams collect and analyze to quantitatively assess the success of their design efforts.
- These KPIs transform data about user behavior and UI interactions into understandable information, enabling teams to draw conclusions and make informed decisions. When tracked over time, they indicate the progress made towards achieving specific design objectives.
- Examples of prominent UX design KPIs include the Net Promoter Score, bounce rate, and returning users rate.
When is the optimal time to measure design performance?
Software developers should address design metrics and KPIs at least in the following situations:
- When preparing for product improvements, such as before a design sprint, after identifying a problem, or following a UX audit that has highlighted usability issues and critical areas needing improvement. In these cases, it’s advisable to gather UX data from the previous 1-2 months.
- After implementing any design changes, to evaluate whether those changes have effectively achieved the intended goals.
This article has been edited from Onix with the title “Main UI/UX Design Metrics and KPIs to Measure” by author Mila Slesar.
Visit Viartisan to read the latest and most in-depth articles on UI, UX, Branding, Develop, and Illustration!


