


3D UI/UX Design Guide 2025: How to Build Immersive, Intuitive, and Interactive Experiences
Sharing
Introduction
In the ever-evolving landscape of User Experience (UX) design, achieving true success requires more than just intuitive design and adherence to best practices. While these are undoubtedly important, they must be complemented by a rigorous approach to measurement. Key Performance Indicators (KPIs) serve as the cornerstone of this approach, providing the quantifiable data necessary to evaluate design effectiveness, track progress, and drive continuous improvement. This comprehensive guide delves into the crucial role of KPIs in UX design, offering a detailed exploration of their definition, significance, selection, and application.
Understanding UX KPIs: Quantifying the intangible
At their core, KPIs are, as the Interaction Design Foundation article defines, “measurements of performance.” They are specific, measurable values that act as indicators of progress towards achieving particular objectives. In the context of UX, KPIs take on the crucial task of translating often-subjective aspects of the user experience – such as ease of use, satisfaction, or efficiency – into objective, quantifiable data. This translation allows designers to move beyond relying on gut feelings or anecdotal evidence and instead ground their decisions in concrete data.
The indispensable role of KPIs in UX design
The strategic implementation of KPIs in UX design yields a multitude of benefits, transforming the design process from an art form to a data-informed discipline:
- Objective Evaluation: Moving Beyond Subjectivity
- KPIs provide a framework for evaluating design effectiveness in a clear and objective manner.
- Instead of relying on subjective opinions or personal preferences, designers can leverage data to support their assessments and justify their design choices.
- This objectivity is crucial for fostering constructive discussions among stakeholders and ensuring that design decisions are aligned with user needs and business goals.
- Data-Driven Decision-Making: Guiding Design Iterations
- KPIs empower designers to make informed decisions based on concrete evidence.
- By tracking KPIs, designers can identify what aspects of the design are performing well and which areas require improvement.
- This data-driven approach facilitates iterative design, allowing designers to continuously refine and optimize the user experience based on user behavior and feedback.
- Tracking Progress Over Time: Demonstrating UX Value
- KPIs enable designers to monitor the impact of design changes and track progress towards achieving specific UX goals.
- This longitudinal perspective is essential for demonstrating the value of UX to stakeholders and justifying investments in UX research and design.
- By showcasing how UX improvements positively influence key metrics, designers can build credibility and secure buy-in for future UX initiatives.
- Identifying Areas for Improvement: Focusing Design Efforts
- KPIs serve as diagnostic tools, helping designers pinpoint specific areas within the user experience that are underperforming or causing user frustration.
- This granular level of insight allows designers to prioritize their efforts and focus on the most impactful improvements, maximizing the efficiency of the design process.
- Alignment with Business Objectives: Connecting UX to ROI
- UX KPIs can be strategically aligned with broader business objectives, such as increasing conversion rates, improving customer retention, or reducing support costs.
- This alignment demonstrates the direct contribution of UX design to the overall success of the business, strengthening the case for UX investment and recognition.
Strategic considerations for KPI selection
Choosing the right KPIs is a critical step in the UX measurement process. The selected KPIs will directly influence the insights gained and the actions taken. The following considerations are essential:
- Relevance: Tailoring KPIs to Specific Goals
- KPIs must be directly relevant to the specific UX goals of the project and the overarching objectives of the product or service.
- For example, if the primary goal is to increase user engagement, relevant KPIs might include time spent on the site, number of interactions, or feature adoption rate.
- Carefully consider the specific context and tailor the KPIs accordingly.
- Measurability: Ensuring Quantifiable Data
- KPIs must be quantifiable, meaning they can be expressed as numerical values.
- This ensures that data can be tracked objectively and that performance can be compared over time.
- Avoid vague or subjective metrics that cannot be reliably measured.
- Actionability: Driving Meaningful Change
- KPIs should provide insights that lead to actionable improvements in the design.
- The data should highlight specific areas where changes are needed and suggest potential solutions.
- Avoid KPIs that are merely descriptive but do not offer guidance for action.
- Clarity: Fostering Shared Understanding
- KPIs must be clearly defined and easily understood by all stakeholders involved in the project, including designers, developers, product managers, and business leaders.
- This shared understanding is crucial for effective communication and collaboration.
- Balance: Capturing a Holistic View
- Employ a balanced set of KPIs to capture different aspects of the user experience.
- Avoid relying on a single metric, as this can provide a narrow and potentially misleading view of performance.
- Consider both behavioral metrics (what users do) and attitudinal metrics (what users say or feel).
Illustrative examples of UX KPIs
The specific KPIs used will vary depending on the product, industry, and project goals. However, here are some commonly used examples of UX KPIs:
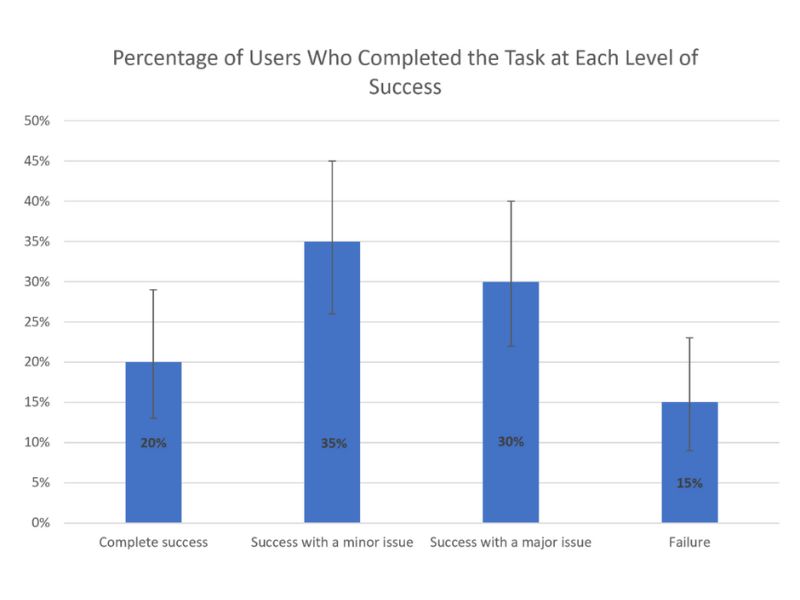
- Task Success Rate:
- The percentage of users who successfully complete a predefined task within the interface.
- This metric directly measures the effectiveness of the design in enabling users to achieve their objectives.
- Example: Percentage of users who successfully complete a purchase on an e-commerce website.
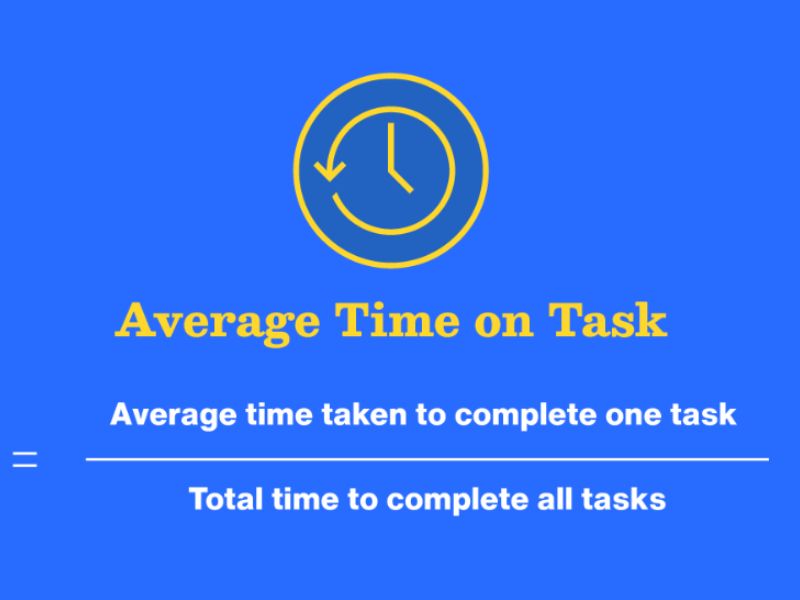
- Time on Task:
- The average amount of time users take to complete a specific task.
- This metric measures the efficiency of the design and identifies potential areas of friction or complexity.
- Example: Average time it takes users to fill out a registration form.
- Error Rate:
- The number of errors users make while attempting to complete a task.
- This metric highlights usability issues and areas where users are likely to encounter difficulties.
- Example: Number of incorrect password entries during a login attempt.

- User Satisfaction (CSAT):
- A measure of users’ subjective satisfaction with a product or service.
- Often collected through surveys or questionnaires using rating scales.
- Example: Average rating on a scale of 1 to 5 for overall product satisfaction.
- Net Promoter Score (NPS):
- A measure of customer loyalty and the likelihood of users recommending the product to others.
- Based on a survey question asking users how likely they are to recommend the product on a scale of 0 to 10.
- Users are categorized as Promoters, Passives, or Detractors.
- Conversion Rate:
- The percentage of users who complete a desired action, such as making a purchase, signing up for a newsletter, 1 or downloading a file.
- This metric directly reflects the effectiveness of the design in driving business goals.
- Example: Percentage of website visitors who complete a purchase.
- Retention Rate:
- The percentage of users who continue to use the product or service over a specific period.
- This metric indicates the product’s ability to retain users and build long-term engagement.
- Example: Percentage of app users who remain active after 30 days.
- Abandonment Rate:
- The percentage of users who abandon a process before completion, such as leaving a shopping cart or abandoning a form.
- This metric highlights potential usability issues or points of friction that are causing users to drop off.
- Example: Percentage of users who abandon their shopping cart before completing the checkout process.
Tools and techniques for effective UX measurement
To accurately track and measure UX KPIs, designers can leverage a variety of tools and techniques:
- Analytics Tools:
- Tools like Google Analytics, Adobe Analytics, and Mixpanel provide valuable data on user behavior, such as page views, bounce rate, session duration, and user flow.
- These tools offer quantitative insights into how users are interacting with the product and can help identify areas for improvement.
- Usability Testing:
- Conducting usability tests with representative users allows for direct observation and measurement of user behavior.
- Usability testing can be used to measure task success rate, time on task, error rate, and other behavioral metrics.
- Surveys and Questionnaires:
- Tools like SurveyMonkey, Google Forms, and Qualtrics enable designers to gather user feedback on satisfaction, usability, and other attitudinal metrics.
- Surveys can be used to collect both quantitative (e.g., rating scales) and qualitative (e.g., open-ended responses) data.
- Heatmaps and Session Recordings:
- Tools like Hotjar, Crazy Egg, and FullStory provide visual representations of user interactions and recordings of user sessions.
- Heatmaps show where users click, scroll, and hover, while session recordings allow designers to observe individual user behavior and identify pain points.
- A/B Testing:
- This technique involves comparing two or more variations of a design element or page to determine which performs best in terms of a specific KPI.
- A/B testing allows designers to make data-driven decisions about design changes and optimize the user experience.
Conclusion: Embracing data-driven UX for user-centric success
In conclusion, KPIs are indispensable tools for UX professionals who strive to create user-centered and effective digital experiences. By carefully selecting, rigorously tracking, and thoughtfully analyzing KPIs, designers can gain a deeper and more nuanced understanding of their users, empower data-driven design decisions, and effectively demonstrate the tangible value of UX design to their organizations. Embracing a data-driven approach is no longer a luxury but an essential prerequisite for creating successful and sustainable digital products and services that truly resonate with users and achieve business objectives.
Visit Viartisan to read the latest and most in-depth articles on UI, UX, Branding, Develop, and Illustration!
This article has been edited from Interation Design with the title “Key Performance Indicators (KPIs)”.


